Hello,
I've made several WRF simulations based on different configurations (Topography ; Convection On/Off ; Physics options ; Vertical levels).
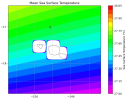
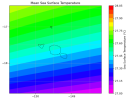
I started to analyze Rain, Wind and GHI (short-wave solar irradiation) 2D-fields and everything looked pretty OK ; but then I looked at temperatures (T2 ; and then T2MEAN with same result) and noticed several grid cells showing temporally punctual anomalous temperature, way lower than expected for the region.
I'm working on Tahiti/Moorea islands in tropical South Pacific. Below is a snapshot of an analysis based on one configuration displaying the location of grid cells showing anomalous temperature values for one month. Except for grid cells over mountainous regions (which I excluded setting threshold to 14°C or less), we do not expect such low temperatures on Tahiti, at any period of the year. Even less such brutal perturbation, i.e. from average 20°C to 12°C or less for one or two hour before temperature raises back up to normal.

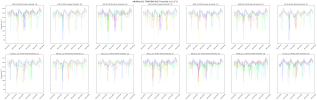
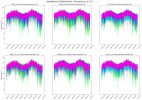
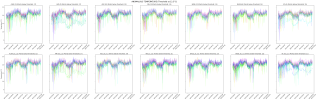
I attached some graphs that show some more details : usually, anomalous temperatures are found around noon (UTC-10 ; time has been converted for post-processing in all the attached graphs). The domain (d02) size is 120x120 at a 2.333 km resolution, nested in a 120x120 domain (d01) at 7 km resolution? Forcing come from previous WRF outputs processed via NDOWN. The islands are voluntarily at the center of both domain to make room for the model to run properly.
The graphs attached show data for different configuration (name is title of each subplot). To help read these figures, please note :
1) The first row is "convection activated" ; the second row is "convection deactivated" (for domain d02)
2) The first 4 columns are topography testings (config. name refers to interpolation method and smoothing pass : 0 or 1) - all on 65 vertical levels
3) Columns 5 and 6 have the same topography (from original WPS data), only the number of vertical levels differ (33 or 65)
4) All 6 first columns have same physics options
5) Last column show a different physics configuration (based on Kain-Fritsh scheme), also en 65 vertical levels
It doesn't seem to be linked to some spin-up time as anomalous temperature can be observed anytime in the simulations. Also, as already stated : rain, wind and GHI fields look OK (compared to ERA5, IMERG and/or in-situ measurements). For now, I don't have much idea what would be causing such brutal temperature drops, particularly near shore (all defective points are near coastline, for all configurations). I wouldn't be surprise this plays a role though I have no idea how it would.
I would gladly read your thoughts on this matter. Also, feel free to advise any further checks I should perform.
I've made several WRF simulations based on different configurations (Topography ; Convection On/Off ; Physics options ; Vertical levels).
I started to analyze Rain, Wind and GHI (short-wave solar irradiation) 2D-fields and everything looked pretty OK ; but then I looked at temperatures (T2 ; and then T2MEAN with same result) and noticed several grid cells showing temporally punctual anomalous temperature, way lower than expected for the region.
I'm working on Tahiti/Moorea islands in tropical South Pacific. Below is a snapshot of an analysis based on one configuration displaying the location of grid cells showing anomalous temperature values for one month. Except for grid cells over mountainous regions (which I excluded setting threshold to 14°C or less), we do not expect such low temperatures on Tahiti, at any period of the year. Even less such brutal perturbation, i.e. from average 20°C to 12°C or less for one or two hour before temperature raises back up to normal.
I attached some graphs that show some more details : usually, anomalous temperatures are found around noon (UTC-10 ; time has been converted for post-processing in all the attached graphs). The domain (d02) size is 120x120 at a 2.333 km resolution, nested in a 120x120 domain (d01) at 7 km resolution? Forcing come from previous WRF outputs processed via NDOWN. The islands are voluntarily at the center of both domain to make room for the model to run properly.
The graphs attached show data for different configuration (name is title of each subplot). To help read these figures, please note :
1) The first row is "convection activated" ; the second row is "convection deactivated" (for domain d02)
2) The first 4 columns are topography testings (config. name refers to interpolation method and smoothing pass : 0 or 1) - all on 65 vertical levels
3) Columns 5 and 6 have the same topography (from original WPS data), only the number of vertical levels differ (33 or 65)
4) All 6 first columns have same physics options
5) Last column show a different physics configuration (based on Kain-Fritsh scheme), also en 65 vertical levels
It doesn't seem to be linked to some spin-up time as anomalous temperature can be observed anytime in the simulations. Also, as already stated : rain, wind and GHI fields look OK (compared to ERA5, IMERG and/or in-situ measurements). For now, I don't have much idea what would be causing such brutal temperature drops, particularly near shore (all defective points are near coastline, for all configurations). I wouldn't be surprise this plays a role though I have no idea how it would.
I would gladly read your thoughts on this matter. Also, feel free to advise any further checks I should perform.
Attachments
Last edited: