Scheduled Downtime
On Friday 21 April 2023 @ 5pm MT, this website will be down for maintenance and expected to return online the morning of 24 April 2023 at the latest

The relative humidity of noahmp scheme is obviously low

This post was from a previous version of the WRF&MPAS-A Support Forum. New replies have been disabled and if you have follow up questions related to this post, then please start a new thread from the forum home page.

hliu20

New member
Hello all, I was running WRF-CHEM4.0 with different sf_surface_physics scheme which include NOAHMP, SLAB and RUC. AND the relative humidity of noahmp scheme is obviously low compared with others, I tried to change some parameters but its still low. SO I output the RH, QFX and LH, I noticed that NOHAMP scheme is obviously low. I am confused why NOAHMP acheme simulated RH is not as good as other schemes?
Any suggestions are very much appreciated.
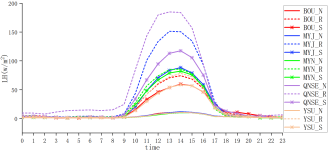
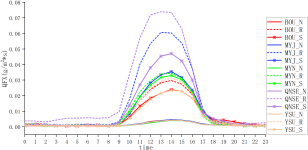
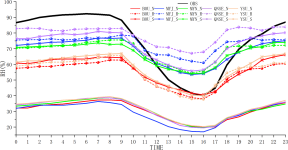
I attached my namelist.input and some pictures(BOUN means BOULAC bl_pbl_physics and NOAHMP sf_surface_pyhsics; BOUR means BOULAC bl_pbl_physics and RUC sf_surface_pyhsics; BOUS means BOULAC bl_pbl_physics and SLAB sf_surface_pyhsics, the rest are similar to this.)
HAO.
 

Attachments

  • mynn-ruc-namelist.input
    8.5 KB · Views: 5
  • mynn-slab-namelist.input
    8.5 KB · Views: 6
  • mynn-noahmp-namelist.input
    8.7 KB · Views: 10
  • 1.png
    1.png
    105.8 KB · Views: 133
  • 2.png
    2.png
    119.4 KB · Views: 133
  • QQ截图20220503150537.png
    QQ截图20220503150537.png
    484.5 KB · Views: 134
I suppose your first plot shows time series of 2m RH. Please let me know if I am wrong. It is hard to tell what schemes (combinations of various schemes) yield abnormally low 2m RH. It seems that at least 4 curves overlap with each other and show low 2m RH. Can you clarify they correspond to what schemes?

we are aware that different schemes may yield quite different results and the results are often case-dependent. It is hard to figure out why some schemes give better or worse results for a specific case. This is why we recommend users to try different options and determine which options can yield the best results.
 
Dear Chen,
Thank you for your reply!
Yes, you're right, the first plot represents 24-hour time series of 2m RH. There is a similar phenomenon in these three pictures, the lowest curves correspond to combinations of NOAHMP sf_surface_physics and different bl_pbl_physics, which means abnormally low 2m RH, QFX and LH will be produced if select NOHAMP surface scheme. I want to know why NOAHMP cause abnormally low 2m RH and how to solve this problem.
Any suggestions will be appreciated!
HAO.
 
Hao,
We run a few test cases using Noah and NoahMP. We compare the surface variables (wind, specific humidity, and 2m T). Please see the attached plots that show the results in summer and winter. We did notice difference between Noah and NoahMP, but we cannot repeat the issue you found.
Note in the plots, 'std' represents noah output.
You may need to look at all NoahMP variables involved in 2m RH and LH calculation, and compare them with other schemes to determine why NoahMP yields low RH and LH.
 

Attachments

  • v44_sfc_winter_noah.pdf
    118.6 KB · Views: 11
  • v44_sfc_summer_noah.pdf
    120.3 KB · Views: 14
Dear Chen,
Thank you for your help!
I'm wondering whether the difference of model version or variables in namelist.input causing that I can't output the right 2m RH and LH. Can you leave the namelist.input here that enable me to learn from please?
HAO.
 
Hao,
I run WRFv4.4, which is the latest release of WRF model. please see the attached namelist.input (for NoahMP).Since our super computer is down, I cannot get the namelist file that is exactly the same as the one I used, But there should have no essential differences.
Please let me know if you have more questions.
 

Attachments

  • namelist.input
    3.9 KB · Views: 15
Top