mantovanijr
New member
Hi everyone.
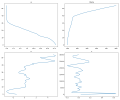
I am trying to plot some vertical profiles from MPAS 8.0.1 history output files. I am using the variables qv (vapor mixing ratio), theta (potential temperature), and u (horizontal velocity), w (vertical velocity). However, only the vertical velocity (w variable) is in function of geometric height, why?
Other question is: the theta profile looks wrong, not? 800 Kelvin on level 55? Model is defined with 55 vertical levels with model top at 30 km.
Look the plot below:

