Scheduled Downtime
On Friday 21 April 2023 @ 5pm MT, this website will be down for maintenance and expected to return online the morning of 24 April 2023 at the latest

Wrfinput_d01 00z vs wrfout_d01_2018-02-19_00:00:00

This post was from a previous version of the WRF&MPAS-A Support Forum. New replies have been disabled and if you have follow up questions related to this post, then please start a new thread from the forum home page.

MartinHagman

New member
Hi all!


Skärmavbild 2019-10-17 kl. 16.32.30.png

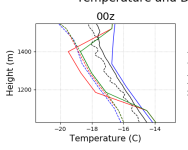
Look at my attached file! It is zoomed in around Sc-clouds.

It depicts temperature and dew point from 4 different sources:

Black: Sounding 00z 20180219

Blue: IFS analysis 00z 20180219

Green : Wrfinput_d01 00z after I have lowered T to Td in 3 levels to get saturated values in clouds. I am trying to initialize clouds from ECMWF and reality into WRF and if I don't lower the temperature, the cloud water immediately disappears.I am calculating the dew point myself from Relative humidity and Saturation water vapor pressure in the wrfinput_d01 nc-file and after that a Python script does the operation for me.

Red: Wrfout for 00z. Fore some reason the temperature here has become lower than the dew point at the 3 levels I have altered....?
At all other levels, the red and green curves are identical both for dew point and temperature... Why is this?

Does anyone have any idea why? It is happening in wrf.exe, but we have not stepped forward in time yet...

Thankful for help!

//Martin
 
Hi Martin,

1) Just to verify - you are making the T changes in the actual wrfinput_d01 file (and not in the code), prior to running wrf, correct?
2) Can you let me know which version of WRF you are using, and let me know if the code is modified at all, or is pristine "out of the box" code?
3) Will you please attach your namelist.input file?
Thanks!
 
Hi Kelly!

Thanks for your answer!

1. Yes I make changes in wrfinput_d01, not in code.

2. 3.9.1.1. The code is pristine and not changed.

Namelist.input is attached.

THANKS!

/Martin
 

Attachments

  • namelist.input
    7 KB · Views: 62
Hi Kelly!

Sorry for late response!

No, if I plot the Theta profile from wrfinput and wrfout at time 0, they are identical. I have tried for 2 different dates, and it is the same.

So, to recap a bit. I lowered the temperature to the dew point in the wrfinput-file. Something happens in wrf.exe between wrfinput and wrfout at time 0. Temperature is lowered and dew point is lowered very little. The result is that the temperature gets lower than the dew point. At ALL other levels both temperature and dew point-curves are identical if you compare wrfinput and wrfout.

I have now also seen that the mixing ratio is constant if I compare the two different files, so it is not changed, BUT the temperature in the wrfout-file is lower than in the wrfinput-file. This leads supersaturation, RH values >100%, in the wrfout-file.

Why is the temperature lower in the wrfout-file at the same time as the mixing ratio and the potential temperature is the same...?

According to the formula for potential temperature, pressure must change if Theta is constant and temperature is changing. That is also what happens in my figures. At every level where I lower the temperature to the dewpoint in wrfinput, the pressure is also lowered, (in the calculations from wrfinput to wrfout at time zero), to keep the potential temperature constant.

So, I presume, the interpolation is done in Theta, and to keep it constant during the interpolation, although this new T in the wrfinput, the pressure is lowered. Am I right? I am disturbing the balance, and that makes this happening...?! Does it have something to do with static stability?


Thanks!

//Martin
 
Hi Martin,
I was able to sit down with our software engineer to try to figure this out. What we think is happening is that the real program is using theta (or temperature) to vertically interpolate pressure, geopotential height, etc. We assume that the temperature is being changed after this, and before wrf is run. When wrf is run, it will now use the new theta value and re-interpolate the values of pressure, etc., which will cause temperature to be different.

In the file dyn_em/module_initialize_real.F, for V3.9.1.1, around line 1754, RH is vertically interpolated (variable is u_1). Around line 1791, temperature is vertically interpolated (variable is t_2), and then around line 1809, pressure is vertically interpolated (variable is p). Right after this final interpolation, you should be able to safely make your temperature changes (using the variable t_2), so probably around line 1823:
Code:
1808          interp_type = 1
1809          CALL vert_interp ( grid%p_gc , grid%pd_gc , grid%p               , grid%pb , &
1810                             grid%pmaxw , grid%ptrop , grid%pmaxw , grid%ptrop , &
1811                             grid%pmaxwnn , grid%ptropnn , &
1812                             flag_pmaxw , flag_ptrop , &
1813                             config_flags%maxw_horiz_pres_diff , config_flags%trop_horiz_pres_diff , &
1814                             config_flags%maxw_above_this_level , &
1815                             num_metgrid_levels , 'T' , &
1816                             interp_type , lagrange_order , t_extrap_type , &
1817                             lowest_lev_from_sfc , use_levels_below_ground , use_surface , &
1818                             zap_close_levels , force_sfc_in_vinterp , grid%id , &
1819                             ids , ide , jds , jde , kds , kde , &
1820                             ims , ime , jms , jme , kms , kme , &
1821                             its , ite , jts , jte , kts , kte )
1822          interp_type = grid%interp_type
1823
 
Top