Scheduled Downtime
On Friday 21 April 2023 @ 5pm MT, this website will be down for maintenance and expected to return online the morning of 24 April 2023 at the latest

em_hill2d_x - behavior with decreasing wind speed

srinaldi

New member
Hi all!

I'm playing around with the em_hill2d_x idealized case. In particular, I'd like to reproduce different flow regimes and I started doing this by changing the vertical profile of the wind. I'm having some issues in understanding the output of the simulations when changing the vertical profile of the wind, though.

The base case has the wind set as u=10 m/s, and from the vertical profile of the potential temperature I found that N=0.01 s-1, resulting in the lineary parameter u/Nh = 10, where h is the hill height, and giving the well known linear solution.
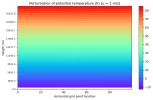
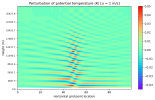
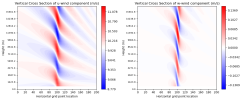
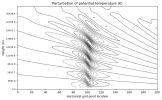
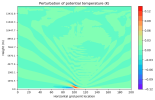
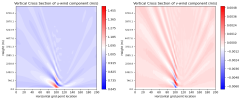
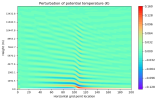
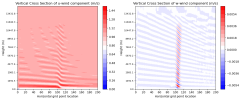
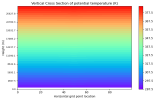
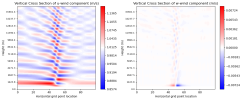
However, if I decrease the wind speed to u=1m/s I get something that I don't well understand, as you can see from the attached figures. First of all, I don't understand why the temperature profile remains the same of the linear case, and then I don't understand what happens at the wind profiles, are there some instabilities arising?

The only thing I changed from the namelist.input is the size of the domain in the west-east direction to have it of 101 gridpoints, then I set the resolution to 1 km and changed the time step accordingly to 6. The hill shape is the same as in the default case, with h=100m and half-width to 5 grid points (so half-width at half-height is 10km if I'm correct).

I hope this question is in line with the topic and the forum.

Thank you very much for your help!
 

Attachments

  • theta_Fr1.png
    theta_Fr1.png
    33.9 KB · Views: 4
  • u_w_Fr1.png
    u_w_Fr1.png
    117.3 KB · Views: 5
Last edited:
I have some experience with mountain meteorology, so I will provide some feedback.

For potential temperature, you should plot perturbation from the base-state potential temperature, instead of raw potential temperature. This is because potential temperature perturbation is proportional to mountain height times d(theta)/dz, which is small compared to the range of theta on the picture (100 K). So just subtract the theta profile you set as the initial condition from the output.

To calculate the theta profile, you can use N=0.01=const. (if it is indeed constant) and integrate the definition of N (you need surface theta as well for the boundary condition).

For the speed plot, how long did you run the simulation and what are the boundary conditions? This velocity field looks good near the ground, but aloft there seem to be reflections (notice the pattern looks like wave field in a 2d channel, when waves can bounce off walls). This can also happen when you have cyclic conditions and wave exits on one side and enters from the other, PACMAN-style. I think open boundary conditions work better? This can also be mitigated by using a larger domain. How large is your domain?
 
I talked your case with our physics expert. Based on his opinion, there exists some reflection from the top.

I wonder whether you turn on damp_opt ?
 
Hi @Pechudin and @Ming Chen, thank you both for your replies. I will answer both of your questions here.

For the potential temperature, I understand thank you. I noticed that I don't have to calculate it because it's already in the wrfout file and I can easily extract it and plot it (please, look at the following section from the ncdump command

float T(Time, bottom_top, south_north, west_east) ;
T:FieldType = 104 ;
T:MemoryOrder = "XYZ" ;
T:description = "perturbation potential temperature theta-t0" ;
T:units = "K" ;
T:stagger = "" ;
T:coordinates = "XLONG XLAT XTIME" ;

Even though it's the perturbation of the potential temperature, I still don't see any kind of wave activity. Please look at the attached figure.

My simulation was 10 hours long, my domain is 101 grid points in the west-east direction, and my boundary conditions are not periodic along this axis.
The damping is turned on (option 3), and the damping coefficient is set to 0.1. Please see the attached namelist.input for more information.
I agree with both of you about the fact that it seems to be some reflection from the top, and looking at it now I guess I should have set either a higher damping coefficient (which the users guide recommend to set as the inverse time scale, so 0.6 in my case), or maybe increasing the damping depth (my top is at 30km and the damping depth is at 20km)?

I will run some tests with increasing domain size and changing the damping options to limit reflection from the top, I'll keep you posted.

Thank you both again!
 

Attachments

  • pert-theta_Fr1.png
    pert-theta_Fr1.png
    29.7 KB · Views: 3
  • namelist.input
    3.4 KB · Views: 1
About the perturbation potential temperature, I mean that you subtract the height-dependent theta profile from the theta field. What you have now is theta minus some constant theta value (probably 300 K). So you calculate the base theta(z), and the subtract it from the result. You can see there is some curviness in the plot, albeit very slight.
 
About the upper-level damping and size of the domain. You want the domain to be much wider than the mountain, not sure how much but I think 10 or 20 times the mountain width could be a good start. This is because the mountain wave will propagate upwards at an angle and you want it to hit the "ceiling" and get absorbed by the Rayleigh damping layer at the top, instead of the sides.

About the upper damping layer. You do not want damping strength to be too strong, because then the waves can reflect. It is better to have a deeper damping layer with lesser strength. The minimum thickness should be one vertical wavelength of the mountain wave.

What did the picture look for the base state, were there any funny reflections?
 
Hi @Pechudin, thank you very much for all the explanations!

About the perturbation potential temperature, I mean that you subtract the height-dependent theta profile from the theta field. What you have now is theta minus some constant theta value (probably 300 K). So you calculate the base theta(z), and the subtract it from the result. You can see there is some curviness in the plot, albeit very slight.
You're right, now I get it! When subtracting the initial vertical profile I get something that make much more sense now (please, look at the attached figure).

What did the picture look for the base state, were there any funny reflections?
About the base state, if you mean the initial vertical profiles, the one for the Theta is the same of the default case, while the one for the u-wind component has u=1 m/s everywhere, as set in the input sounding. Please, tell me if I misunderstood what you were asking me.

As soon as I set my domain following your suggestions, I'll get back to you to show the results.

Thank you again!
 

Attachments

  • pert-theta_Fr1_new.png
    pert-theta_Fr1_new.png
    82.6 KB · Views: 3
About the base state, if you mean the initial vertical profiles, the one for the Theta is the same of the default case, while the one for the u-wind component has u=1 m/s everywhere, as set in the input sounding. Please, tell me if I misunderstood what you were asking me.

I mean the default simulation, with U = 10 m/s. Was that also full of reflections?
 
Could this be because of your vertical resolution, i.e., maybe it is too coarse? Consider this. The vertical wavelength of the mountain wave is:

2*pi*U/N,

where U is mean speed, N is BV frequency. For U = 10 and N = 0.01, this is around 6 km. This means that in 15 km you get 3 peaks and 3 troughs (as you see in the pictures you just attached). For U = 1, your vertical wavelength is 600 m, much smaller (as you can see in the original pictures, you have many peaks and troughs along the vertical).

Now, you have 100 vertical levels and the top is at 30 km, this means your vertical spacing could be 300 m, which is dangerously close to the vertical wavelength. What is your vertical resolution, is it stretching or is it uniform (meaning ~ 300 m between levels)? This could be fixed by increasing the vertical resolution or decreasing the model top (both would decrease the spacing between vertical levels).

The reason I am asking is because the figure with errors looks "pixelated", like there are steps. This could be because of insufficient vertical resolution, and in that case you need to keep in mind the ratio of your grid spacing to the smallest expected vertical wavelength.

Basically: I think these errors are due to numerical errors that occur when forcing the numerical grid with a wave whose wavelength is close to the grid spacing. Are you familiar with errors that happen when this occurs (aliasing, incorrect phase speed, etc.)?
 
Last edited:
I'm so sorry, I attached the wrong namelist.input. The only thing that is wrong is that I run the U=1 simulation with 40 vertical levels instead of 100, but the setup of the domain is still the same.

What is your vertical resolution, is it stretching or is it uniform (meaning ~ 300 m between levels)?
Since I didn't specified any stretching factor, I assumed that the levels were equally spaced, but looking at the wrfout file I can see that the options for vertical stretching are enabled:

:AUTO_LEVELS_OPT = 2 ;
:DIFF_6TH_THRESH = 0.1f ;
:DZBOT = 50.f ;
:DZSTRETCH_S = 1.3f ;
:DZSTRETCH_U = 1.1f ;

Anyway, I guess this doesn't change much your point, i.e. resolution too close to the vertical wavelength of 600m, but enough to appreciate waves with vertical wavelength of 6km.

Are you familiar with errors that happen when this occurs (aliasing, incorrect phase speed, etc.)?
No, actually I'm not. I will look into that if you think It would be useful.

Thank you very much!
 
Last edited:
I suppose you have already tried it, but to fix this (if I am right), just add more vertical levels (maybe double or triple the number), reduce the maximum height of the domain (slashing it in half increases the density to double) while taking care of the sponge layer, or decrease N to increase Froude number.
 
I've lowered the top of the domain from 30 km to 15 km and increased the vertical levels to 100. Having the top at 15 km I had also to decrease the dumping layer to 10 km. Attached here you can find the results of the simulation with the new setup of the domain.
From these plots, I would say that it's still the linear solution, hence I have to further decrease the U to catch a nonlinear behavior.
I wish I would manage to plot streamlines to better see features, but I'm struggling making it work.
 

Attachments

  • pert-theta_Fr1_new.png
    pert-theta_Fr1_new.png
    43.9 KB · Views: 0
  • u_w_Fr1_new.png
    u_w_Fr1_new.png
    84.5 KB · Views: 0
Top