You are using an out of date browser. It may not display this or other websites correctly.
You should upgrade or use an alternative browser.
You should upgrade or use an alternative browser.
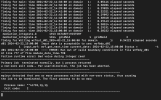
ERROR: Ran out of valid boundary conditions in file wrfbdy_d01At line 777 of file module_date_time.f90
- Thread starter ilhaskam
- Start date
Hi,
The following settings are listed in your namelist.input file:
So it looks like you are wanting to run for a total of 15 hours, according to the start/end parameters; however, you have run_hours set to 24. The real.exe program looks at the start/end parameters and creates boundary conditions according to those, meaning the final BC should be 2024-02-22_15:00:00. Meanwhile, wrf.exe uses the run_* settings and is looking for times after the ending boundary condition - to make it all the way to 24 hours. You just need to set run_hours = 15 and you should be okay.
The following settings are listed in your namelist.input file:
Code:
 run_hours                           = 24,
 run_minutes                         = 0,
 run_seconds                         = 0,
 start_year                          = 2024, 2024, 2024,
 start_month                         = 02,   02,   02,
 start_day                           = 22,   22,   22,
 start_hour                          = 00,   00,   00,
 start_minute                        = 00,   00,   00,
 start_second                        = 00,   00,   00,
 end_year                            = 2024, 2024, 2024,
 end_month                           = 02,   02,   02,
 end_day                             = 22,   22,   22,
 end_hour                            = 15,   15,   15,
 end_minute                          = 00,   00,   00,
 end_second                          = 00,   00,   00,
So it looks like you are wanting to run for a total of 15 hours, according to the start/end parameters; however, you have run_hours set to 24. The real.exe program looks at the start/end parameters and creates boundary conditions according to those, meaning the final BC should be 2024-02-22_15:00:00. Meanwhile, wrf.exe uses the run_* settings and is looking for times after the ending boundary condition - to make it all the way to 24 hours. You just need to set run_hours = 15 and you should be okay.
okay thank you kwerner, i fix itHi,
The following settings are listed in your namelist.input file:
Code:run_hours = 24, run_minutes = 0, run_seconds = 0, start_year = 2024, 2024, 2024, start_month = 02, 02, 02, start_day = 22, 22, 22, start_hour = 00, 00, 00, start_minute = 00, 00, 00, start_second = 00, 00, 00, end_year = 2024, 2024, 2024, end_month = 02, 02, 02, end_day = 22, 22, 22, end_hour = 15, 15, 15, end_minute = 00, 00, 00, end_second = 00, 00, 00,
So it looks like you are wanting to run for a total of 15 hours, according to the start/end parameters; however, you have run_hours set to 24. The real.exe program looks at the start/end parameters and creates boundary conditions according to those, meaning the final BC should be 2024-02-22_15:00:00. Meanwhile, wrf.exe uses the run_* settings and is looking for times after the ending boundary condition - to make it all the way to 24 hours. You just need to set run_hours = 15 and you should be okay.
hello kwerner, after fixing the previous problem, I was able to output the wrfoutput file, but when running the ncl script to get an image of the wrfoutput file there was a problem like this, can you help me again
and wrf_Precip_multi_files_total_pdf.ncl
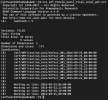
Variable: FILES
Type: string
Total Size: 48 bytes
6 values
Number of Dimensions: 1
Dimensions and sizes: [6]
Coordinates:
(0) /wrf/WRF/test/em_real/wrfout_d01_2024-02-22_00:00:00
(1) /wrf/WRF/test/em_real/wrfout_d01_2024-02-22_03:00:00
(2) /wrf/WRF/test/em_real/wrfout_d01_2024-02-22_06:00:00
(3) /wrf/WRF/test/em_real/wrfout_d01_2024-02-22_09:00:00
(4) /wrf/WRF/test/em_real/wrfout_d01_2024-02-22_12:00:00
(5) /wrf/WRF/test/em_real/wrfout_d01_2024-02-22_15:00:00
(0)
fatal:Minus: Dimension size, for dimension number 0, of operands does not match, can't continue
fatal:["Execute.c":8640]:Execute: Error occurred at or near line 69 in file wrf_Precip_multi_files_total_pdf.ncl
and wrf_Precip_multi_files_total_pdf.ncl
; Example script to produce plots for a WRF real-data run,
; with the ARW coordinate dynamics option.
load "$NCARG_ROOT/lib/ncarg/nclscripts/csm/gsn_code.ncl"
load "$NCARG_ROOT/lib/ncarg/nclscripts/wrf/WRFUserARW.ncl"
;load "./WRFUserARW.ncl"
begin
;
; Make a list of all files we are interested in
DATADir = "/wrf/WRF/test/em_real/"
FILES = systemfunc (" ls -1 " + DATADir + "wrfout* ")
numFILES = dimsizes(FILES)
print("numFILES = " + numFILES)
print(FILES)
print (" ")
; We generate plots, but what kind do we prefer?
; type = "x11"
type = "pdf"
; type = "ps"
; type = "ncgm"
wks = gsn_open_wks(type,"plt_Precip_multi_total")
; Set some basic resources
res = True
res@MainTitle = "Docker Test WRF"
pltres = True
mpres = True
mpres@mpGeophysicalLineColor = "Black"
mpres@mpNationalLineColor = "Black"
mpres@mpUSStateLineColor = "Black"
mpres@mpGridLineColor = "Black"
mpres@mpLimbLineColor = "Black"
mpres@mpPerimLineColor = "Black"
;;;;;;;;;;;;;;;;;;;;;;;;;;;;;;;;;;;;;;;;;;;;;;;;;;;;;;;;;;;;;;;;
a = addfiles(FILES+".nc","r")
times = wrf_user_getvar(a,"times",-1) ; get all times in the file
ntimes = dimsizes(times) ; number of times in the file
slp = wrf_user_getvar(a,"slp",-1) ; slp
wrf_smooth_2d( slp, 3 ) ; smooth slp
; Get non-convective, convective and total precipitation
rain_exp = wrf_user_getvar(a,"RAINNC",-1)
rain_con = wrf_user_getvar(a,"RAINC",-1)
rain_tot = rain_exp + rain_con
rain_tot@description = "Total Precipitation"
; just creating new arrays here
rain_exp_tend = rain_exp
rain_con_tend = rain_con
rain_tot_tend = rain_tot
rain_exp_tend = 0.0
rain_con_tend = 0.0
rain_tot_tend = 0.0
rain_exp_tend@description = "Explicit Precipitation Tendency"
rain_con_tend@description = "Param Precipitation Tendency"
rain_tot_tend@description = "Precipitation Tendency"
; Calculate tendency values
; We know our data is available every 3 hours, so setting tend_int to 1 gives
; tendencies for 3 hours, setting it to 2, gives 6hourly tendencies
tend_int = 2
rain_exp_tend(tend_int:ntimes-1:tend_int,:,= rain_exp(tend_int:ntimes-1:tend_int,:,
- rain_exp(0:ntimes-2:tend_int,:,
rain_con_tend(tend_int:ntimes-1:tend_int,:,= rain_con(tend_int:ntimes-1:tend_int,:,
- rain_con(0:ntimes-2:tend_int,:,
rain_tot_tend(tend_int:ntimes-1:tend_int,:,= rain_tot(tend_int:ntimes-1:tend_int,:,
- rain_tot(0:ntimes-2:tend_int,:,
;;;;;;;;;;;;;;;;;;;;;;;;;;;;;;;;;;;;;;;;;;;;;;;;;;;;;;;;;;;;;;;;
do it = tend_int,ntimes-1,tend_int ; Let's skip the first time as rain is 0 here
print("Working on time: " + times(it) )
res@TimeLabel = times(it) ; Set Valid time to use on plots
; Plotting options for Sea Level Pressure
opts_psl = res
opts_psl@ContourParameters = (/ 900., 1100., 2. /)
opts_psl@cnLineColor = "Blue"
opts_psl@cnInfoLabelOn = False
opts_psl@cnLineLabelFontHeightF = 0.01
opts_psl@cnLineLabelPerimOn = False
opts_psl@gsnContourLineThicknessesScale = 1.5
contour_psl = wrf_contour(a[it],wks,slp(it,:,,opts_psl)
delete(opts_psl)
; Plotting options for Precipitation
opts_r = res
opts_r@UnitLabel = "mm"
opts_r@cnLevelSelectionMode = "ExplicitLevels"
opts_r@cnLevels = (/ .1, .2, .4, .8, 1.6, 3.2, 6.4, \
12.8, 25.6, 51.2, 102.4/)
opts_r@cnFillColors = (/"White","White","DarkOliveGreen1", \
"DarkOliveGreen3","Chartreuse", \
"Chartreuse3","Green","ForestGreen", \
"Yellow","Orange","Red","Violet"/)
opts_r@cnInfoLabelOn = False
opts_r@cnConstFLabelOn = False
opts_r@cnFillOn = True
; Total Precipitation (color fill)
contour_tot = wrf_contour(a[it],wks, rain_tot(it,:,, opts_r)
; Precipitation Tendencies
opts_r@SubFieldTitle = "from " + times(it-tend_int) + " to " + times(it)
contour_tend = wrf_contour(a[it],wks, rain_tot_tend(it,:,,opts_r) ; total (color)
contour_res = wrf_contour(a[it],wks,rain_exp_tend(it,:,,opts_r) ; exp (color)
opts_r@cnFillOn = False
opts_r@cnLineColor = "Red4"
contour_prm = wrf_contour(a[it],wks,rain_con_tend(it,:,,opts_r) ; con (red lines)
delete(opts_r)
; MAKE PLOTS
; Total Precipitation
plot = wrf_map_overlays(a[it],wks,contour_tot,pltres,mpres)
; Total Precipitation Tendency + SLP
; plot = wrf_map_overlays(a[it],wks,(/contour_tend,contour_psl/),pltres,mpres)
; Non-Convective and Convective Precipiation Tendencies
; plot = wrf_map_overlays(a[it],wks,(/contour_res,contour_prm/),pltres,mpres)
;;;;;;;;;;;;;;;;;;;;;;;;;;;;;;;;;;;;;;;;;;;;;;;;;;;;;;;;;;;;;;;;
end do ; END OF TIME LOOP
end
Attachments
I'm glad the original problem was able to be fixed. Since your new problem is an entirely different issue, please open a new thread to ask about it. Furthermore, there is a specific NCL section of the forum where you can post ncl-specific questions (see the home page).


