Hello!
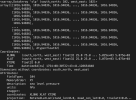
I've successfully set up WRF and have also run a couple of the test cases included in WRF4.4.1 (em_fire, em_quarter_ss). These runs are successful as well and output the standard `wrfout_d01_0001-01-01_00:00:00` type files. I then attempt to visualize these files (example, SLP) using wrf-python and discover the projection is `RotatedLatLon`:

It is unclear how to get this to display appropriately using the plotting tutorial here: Plotting Examples — wrf-python 1.3.4.1 documentation (the resulting image is useless). I assume I need the data in Lambert or some other projection that is more suitable for display.
Is there a way to configure the idealized test cases to use Lambert in WRF OR is there a succinct method for converting the projection to Lambert using wrf-python or other geospatial lib?
Thank you!
I've successfully set up WRF and have also run a couple of the test cases included in WRF4.4.1 (em_fire, em_quarter_ss). These runs are successful as well and output the standard `wrfout_d01_0001-01-01_00:00:00` type files. I then attempt to visualize these files (example, SLP) using wrf-python and discover the projection is `RotatedLatLon`:

It is unclear how to get this to display appropriately using the plotting tutorial here: Plotting Examples — wrf-python 1.3.4.1 documentation (the resulting image is useless). I assume I need the data in Lambert or some other projection that is more suitable for display.
Is there a way to configure the idealized test cases to use Lambert in WRF OR is there a succinct method for converting the projection to Lambert using wrf-python or other geospatial lib?
Thank you!
