Hi there,
I am trying to do 1-day simulations using ECMWF HRES 0.1x0.1 hourly lat/lon grid data and analyze the SST over a lake on the center of my domain.
I'm using Analysis product for the 00 UTC data and Forecast product for the other 23 steps. WRF Version is 4.1.5.
When I run metgrid.exe with default METGRID.TBL and plot SST field of met_em files, while between 02 and 24 UTC the SST field over lake represents the LANDMASK, it is different than LANDMASK and coarse on 00 and 01 UTC met_em files. I've done a research and found that changing METGRID.TBL might work. So I made these modifications to my METGRID.TBL:
After this modification I get met_em files that represents the LANDMASK well on all time steps. So I move on to real.exe and wrf.exe. I'm using sst_update=1.
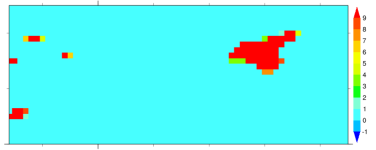
Simulation is completed successfully. However, after I plot SST field of wrfout files, SST pattern of 00 UTC and 01 UTC is completely different from the SST pattern of other timesteps. SST of 0 and 1 UTC seems reasonable however on other timesteps, there are very cold temperature values on the outer boundary of the lake. Thus, that low temperature values are interpolated to other small water areas that are close to the lake, so those water points have wrong values as well.
What might be the problem?
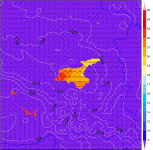
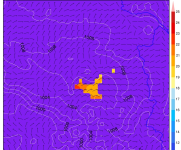
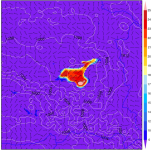
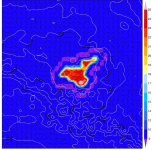
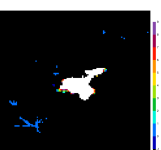
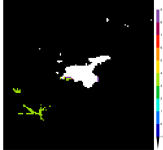
Im attaching wrfout output of 00 UTC (0.png) and 02 UTC (2.png) in order for you to see the difference in the patterns. "0utcdef.png " and "2utcdef.png" are example of wrfout with default METGRID.TBL. I'm attaching my namelist.wps and namelist.input file as well.
Thanks in advance.
I am trying to do 1-day simulations using ECMWF HRES 0.1x0.1 hourly lat/lon grid data and analyze the SST over a lake on the center of my domain.
I'm using Analysis product for the 00 UTC data and Forecast product for the other 23 steps. WRF Version is 4.1.5.
When I run metgrid.exe with default METGRID.TBL and plot SST field of met_em files, while between 02 and 24 UTC the SST field over lake represents the LANDMASK, it is different than LANDMASK and coarse on 00 and 01 UTC met_em files. I've done a research and found that changing METGRID.TBL might work. So I made these modifications to my METGRID.TBL:
Code:
DEFAULT METGRID.TBL
---------------------------
name=SST
        interp_option=sixteen_pt+four_pt
        fill_missing=0.
        missing_value=-1.E30
        flag_in_output=FLAG_SST
Code:
MODIFIED METGRID.TBL
----------------------------
name=SST
	interp_option=sixteen_pt+four_pt+wt_average_4pt+wt_average_16pt+search
	missing_value=-1.E30
	fill_missing=0.
	flag_in_output=FLAG_SST
	masked=land
interp_mask=LANDMASK(1)
After this modification I get met_em files that represents the LANDMASK well on all time steps. So I move on to real.exe and wrf.exe. I'm using sst_update=1.
Simulation is completed successfully. However, after I plot SST field of wrfout files, SST pattern of 00 UTC and 01 UTC is completely different from the SST pattern of other timesteps. SST of 0 and 1 UTC seems reasonable however on other timesteps, there are very cold temperature values on the outer boundary of the lake. Thus, that low temperature values are interpolated to other small water areas that are close to the lake, so those water points have wrong values as well.
What might be the problem?
Im attaching wrfout output of 00 UTC (0.png) and 02 UTC (2.png) in order for you to see the difference in the patterns. "0utcdef.png " and "2utcdef.png" are example of wrfout with default METGRID.TBL. I'm attaching my namelist.wps and namelist.input file as well.
Thanks in advance.

