BartSmulders
New member
Hi all,
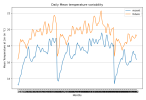
I'm not sure how to clearly describe my problem, but I have tried to take the mean value of my area and plot this over all the days I modelled to get a view of the season bond variations. However, as shown in the figure below, the same trend occurs 3 times in my output, which is obviously incorrect. I think this has something to do with how the data is nudged, but I don't even know how to start figuring out if this is the issue. Does anyone know why this happens and what I can do about it?
Additional info:
The start and end dates of the figure below are 1st of April - 30th of September (recent is averaged over the years 2008 - 2017 and future 2050 - 2059)
However WRF was run 3 times. First, for the months of June, July, and August and then a restart of that data for September; I also ran it a last time for the months of April and March. Therefore, the steep drops are because 1. the data doesn't neatly continue and 2. because the "warm-up" time should have been longer.
I also see the same thing happening for different variables like water vapour mixing ratio and windspeed, although the trends are not the same as this one.

