Scheduled Downtime
On Friday 21 April 2023 @ 5pm MT, this website will be down for maintenance and expected to return online the morning of 24 April 2023 at the latest

Seeking Feedback on Significant Precipitation Reduction in Future WRF Simulations

Arty

Member
Hello everyone,

I am reaching out with this post because I am questioning the coherence of my future simulations, and I hope that your experience and insights can help me understand the issue. Thank you in advance for your support in resolving what might be a significant problem.

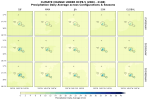
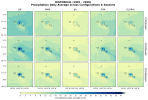
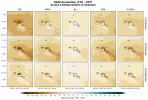
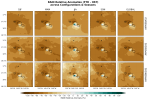
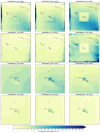
After an initial analysis of my historical (HST) and future (FTR) long-term simulations, I noticed a drastic decrease in precipitation over Tahiti (as well as over the rest of the high-resolution domain) under future conditions. This issue appears across all three configurations I used. The most surprising observation is the near disappearance of the annual cycle (see attached figures: RAIN_SEASONAL_AVG_HST.png; RAIN_SEASONAL_AVG_FTR.png; ABSOLUTE_RAIN_ANOMALY_FTR_HST.png).

My first instinct was to check what CMIP5 models project for this region using the IPCC Interactive Atlas. However, the results and uncertainties are too broad to draw clear conclusions. My boundary forcing data are based on an adaptation of NCEP2 + CMIP5 MMM under RCP8.5 (as per Dutheil et al., 2019 - using Pseudo-Global-Warming approach).

To investigate further, I conducted the following checks:
  • Input File Verification:
    • wrfinput:
      • d01 was generated from Dutheil's wrfout* using NDOWN (+ see comment for wrfbdy below).
      • d02 was generated by interpolating d01 (using a Bash/NCO/CDO script).
    • wrfbdy:
      • d01 was also derived from Dutheil's wrfout* via NDOWN (no d02 required).
      • I ensured that I did not mix up the source wrfout* files for NDOWN (confirmed by naming conventions: wrfout* PD (Present Day) ends with *00:00:00, while wrfout* CC (Climate Change) ends with *.nc).
    • wrflowinp:
      • d01 and d02 were generated from Dutheil’s wrfout* using a Bash/NCO/CDO script (containing only SST and VEGFRA variables).
→ No apparent issues here, but I welcome a second opinion.
  • Namelist Consistency:
    • I compared namelists between HST and FTR for all three configurations. The absence of differences (checked via alias dify = "diff -y --suppress-common-lines") confirms consistency (no output from following command lines):
Code:
dify A4P0SBA33/rundir/A4P0SBA33_execute/19910201_19910228/namelist.input A4P0SBA32_FTR/rundir/A4P0SBA32_FTR_execute/19910201_19910228/namelist.input
dify A4P0SBD33/rundir/A4P0SBD33_execute/19910201_19910228/namelist.input A4P0SBD32_FTR/rundir/A4P0SBD32_FTR_execute/19910201_19910228/namelist.input
dify A4P0SBD33/rundir/A4P0SBKD32_execute/19910201_19910228/namelist.input A4P0SBD32_FTR/rundir/A4P0SBK32_FTR_execute/19910201_19910228/namelist.input
  • Trends in Dutheil’s wrfout* Data:
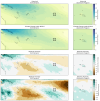
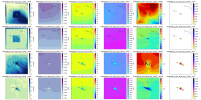
    • Since my simulations end on May 31, 2016, I retrieved RAINC, RAINNC, and RAINSH for the last timestep of the PD and CC files on this date.
    • I summed these three variables (total accumulated precipitation over the entire simulation) and divided by the number of days since the start (01/01/1980) to obtain daily averages for PD and CC.
→ Discrepancies appear minor over Tahiti (see CYRIL_PRECIPITATION_COMPARISON.png), much smaller than in my simulations. Moreover, my results show a negative anomaly, while Dutheil’s suggest a slight positive trend.

At this stage, I am perplexed.

I understand that changing resolution—twice in this case, from 21 km to 7 km (d01), then from 7 km to 2.333 km (d02)—inevitably influences precipitation patterns. However, I expected large-scale forcing to have a dominant influence on domain-wide patterns. I would have been less surprised if Dutheil’s simulations exhibited a similar trend, but they do not.

I lack the experience to determine whether my simulations' behavior is plausible or if something is fundamentally wrong. That’s why I am seeking your expert advice.

Thank you very much in advance for your help!

P.S.: Note that I have also reached out to Dutheil et al. for their insights, but I’m eager to hear your perspectives on this matter as well.
 

Attachments

  • RAIN_SEASONAL_AVG_FTR.png
    RAIN_SEASONAL_AVG_FTR.png
    618.6 KB · Views: 12
  • RAIN_SEASONAL_AVG_HST.png
    RAIN_SEASONAL_AVG_HST.png
    704.1 KB · Views: 9
  • CYRIL_PRECIPITATION_COMPARISON.png
    CYRIL_PRECIPITATION_COMPARISON.png
    850.8 KB · Views: 9
  • ABSOLUTE_RAIN_ANOMALY_FTR_HST.png
    ABSOLUTE_RAIN_ANOMALY_FTR_HST.png
    670.3 KB · Views: 8
  • RELATIVE_RAIN_ANOMALY_FTR_HST.png
    RELATIVE_RAIN_ANOMALY_FTR_HST.png
    688.2 KB · Views: 8
To complement the post above, I'd like to share the figure below, which shows the average daily precipitation for the three configurations (HST and FTR runs) across both domains.

You might also be interested in knowing the main difference between configurations :

Config.d01d02
A4P0SBA32BMJBMJ
A4P0SBD32BMJNone
A4P0SBKD32KFNone
 

Attachments

  • AVERAGE_RAIN_ALL_CONFIGS_DOMAINS_AND_PERIODS.png
    AVERAGE_RAIN_ALL_CONFIGS_DOMAINS_AND_PERIODS.png
    645.6 KB · Views: 10
Last edited:
Hi, Apologies for the long delay in response while our team tended to time-sensitive obligations. Thank you for your patience.

I spoke to a physics specialist, who says it does look like a shift in the large-scale convergence zone, which may explain the loss of the seasonal signal. Also we see the clear precipitation boxes where the outer domain convective scheme may have suppressed the nest precipitation. If you have feedback on, try turning it off and see if that helps.
No worries about the delay, and thanks for your response.

I've had time to explore the potential causes and have run several tests. It appears that my HST runs are erroneous due to flawed initialization, which led to significantly heavier precipitation than observed. This, in turn, explains the drying effect seen in contrast with future climate change runs.

I should note here that, contrary to my initial expectations due to lack of experience, flawed initialization can introduce long-term biases. It seems that the boundary conditions were somehow "mis-transferred" to d01, as if the induced perturbation resulted from uncorrelated wrfinput* and wrfbdy* files—my bad.

Regarding the precipitation boxes enclosed by finer domain boundaries, I indeed ran two-way simulations and wondered whether I should try one-way instead—or even run d01 only and run d02 as an NDOWN-downscaling from d01, as I noticed flawed precipitation accumulation in d01 around d02 borders.
 
Would you please clarify what is wrong in your "flawed initialization" ?
As for flawed precipitation accumulation in d01 around d02 borders, it is a common feature for nested run, which reflects grid-dependent precipitation distribution. One-way and two-way nesting both show such features. In this case, I would suggest that you stay with two-way nesting. In your subsequent analysis, you can exclude data along the boundary.
Hello Ming,

I realize that I should have explained my issue more clearly—my apologies for any confusion. To summarize briefly: I used the same initialization files from my test runs (which started in 2013/09) for my historical long-term simulations (starting in 1991/02 - simply adjusting the date accordingly), assuming that a three-month spin-up period would be sufficient to dampen the initial state. However, I have since discovered that this is not the case—not even after several years of simulation.

For a more detailed explanation, let me first outline my approach:

I am working on high-resolution simulations for Tahiti (7 km and 2.3 km resolution), downscaling from a 21 km resolution using NDOWN. These inputs are themselves the outputs of a first downscaling step from 105 km-resolution data. Initially, I created WRF input files for all four domains (105 km, 21 km, 7 km, and 2.3 km) using WPS with CFSRv2 reanalysis to ensure the appropriate domain properties. Then, I used the 7 km-resolution wrfinput file as wrfndi to run NDOWN and obtain the correct wrfinput file for d01. Additionally, I generated a wrfinput file for d02 based on the previous wrfinput_d01 using a custom script (utilizing CDO and NCO).

During my test runs (which began in 2013/09), I experimented with various configurations, including different physics schemes, topographical datasets, and numbers of vertical levels. While testing different physics combinations, I encountered an issue when running simulations with Noah LSM using WRF input files from NDOWN—these runs failed, whereas they worked fine with the Thermal Diffusion scheme. To work around this, I opted to use WRF input files generated directly from WPS/CFSRv2 instead. In hindsight, this was a flawed approach, though I only realized it much later. At the time, I assumed that as the simulation progressed, the influence of the initialization state would diminish, given that new atmospheric conditions were continuously advected into the domain via the wrfbdy* and wrflowinput* files, which were correctly created.

With this assumption in mind, I used the WRF input files from my test runs when launching my historical production runs, simply adjusting the date accordingly. I believed that after a few months, the initialization state would no longer be a significant factor. However, I now understand that this was a major misconception.

And I realize that makes my first-post following statement untrue :
To investigate further, I conducted the following checks:
  • Input File Verification:
    • wrfinput:
      • d01 was generated from Dutheil's wrfout* using NDOWN (+ see comment for wrfbdy below).
It is true for tests runs and futur climate change production runs.

Through numerous tests, I have come to realize that an inconsistency between the wrfinput* and wrfbdy* files can create long-lasting, self-sustaining boundary perturbations. For instance, I observed significant discrepancies in wind direction and speed, which in turn led to excessive precipitation and other irregularities. The attached figures compare the flawed simulation (OLD) with the corrected one where I use proper initialization files (NEW) for both domains, d01 and d02, based on a two-year average. As shown, the flawed simulation exhibits substantial deviations in wind patterns, as well as notable differences in pressure and precipitation.

This experience has been a steep learning curve, but I have gained invaluable insights along the way. I sincerely appreciate the patience and support I have received from this community, and I apologize for any inconvenience my numerous questions may have caused. That said, I am truly grateful for the guidance and knowledge shared here.
 

Attachments

  • OLD_NEW_COMPARISON.png
    OLD_NEW_COMPARISON.png
    921.6 KB · Views: 4
Last edited:
Hi Mauger,
Many thanks for the detailed explanation.
Personally I always think that initial condition is more important for short-term ( e.g., <120hr) WRF simulation, and lateral boundary forcing is more important for long-term (e.g., seasonal to multi-year) simulation. However, I never really do any multi-year simulations to evaluate the above idea.
Your result provides valuable information for us to better understand the impact of initial and lateral forcing on WRF performance. Thanks again.
 
Top