Hello MPAS-A Forum! This is my first time posting here so apologies if I forget to include some crucial information.
I am attempting to use MPAS-A (uniform 60km resolution mesh) to replay some Arctic cold air intrusions and warm air outbreaks, and I am investigating how long MPAS-A stays faithful to the ERA5 reanalysis conditions. I noticed that both the 2 Meter Temperature and the Skin Temperature are initialized at reasonable values, and then become very cold very quickly. I investigated the sea surface temperature, and found that, despite using initial conditions and update files with MPAS, the SST beneath the sea ice is not being initialized correctly or being updated.
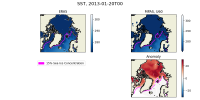
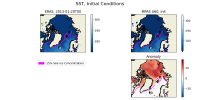
I have attached two plots. The first is an Arctic area weighted average of skin temperature and SST of an MPAS-A run initialized on January 20th, 2013. It shows that the skin temperature is initialized at a reasonable value and then becomes much colder in MPAS than ERA5, and it shows that the MPAS SST starts well below the ERA5 initial conditions. The second plot is a map of SSTs at the first model timestep (January 20th, 2013, 00h), in ERA5, and MPAS-A (uniform 60km resolution), as well as their anomaly. I have plotted the 15% sea ice concentration contour. This shows that the MPAS-A cold bias only occurs underneath the sea-ice.
I would appreciate any tips on why this is happening! Is there a way to have a skin temperature update file to periodically push the MPAS-A skin temp back to ERA5 values, like how we update SST and sea ice concentrations? On maybe a more concerning note, why are the SSTs beneath the sea-ice edge not being initialized at the ERA5 values? Have I set something incorrectly in my namelists?
Namelist and streams files have been attached as well.
I look forward to hearing from you all!
I am attempting to use MPAS-A (uniform 60km resolution mesh) to replay some Arctic cold air intrusions and warm air outbreaks, and I am investigating how long MPAS-A stays faithful to the ERA5 reanalysis conditions. I noticed that both the 2 Meter Temperature and the Skin Temperature are initialized at reasonable values, and then become very cold very quickly. I investigated the sea surface temperature, and found that, despite using initial conditions and update files with MPAS, the SST beneath the sea ice is not being initialized correctly or being updated.
I have attached two plots. The first is an Arctic area weighted average of skin temperature and SST of an MPAS-A run initialized on January 20th, 2013. It shows that the skin temperature is initialized at a reasonable value and then becomes much colder in MPAS than ERA5, and it shows that the MPAS SST starts well below the ERA5 initial conditions. The second plot is a map of SSTs at the first model timestep (January 20th, 2013, 00h), in ERA5, and MPAS-A (uniform 60km resolution), as well as their anomaly. I have plotted the 15% sea ice concentration contour. This shows that the MPAS-A cold bias only occurs underneath the sea-ice.
I would appreciate any tips on why this is happening! Is there a way to have a skin temperature update file to periodically push the MPAS-A skin temp back to ERA5 values, like how we update SST and sea ice concentrations? On maybe a more concerning note, why are the SSTs beneath the sea-ice edge not being initialized at the ERA5 values? Have I set something incorrectly in my namelists?
Namelist and streams files have been attached as well.
I look forward to hearing from you all!