Scheduled Downtime
On Friday 21 April 2023 @ 5pm MT, this website will be down for maintenance and expected to return online the morning of 24 April 2023 at the latest

SST input resolution and LANDMASK

Pechudin

Member
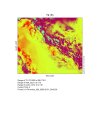
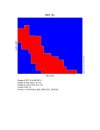
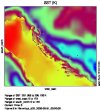
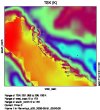
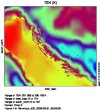
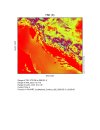
Today I have noticed these weird squares in the simulations over the Adriatic. Turns out this is the consequence of the ERA5's SST resolution (which is, as are all ERA5 variables, 1/4 of a degree). My question is - what kind of impact can I expect from keeping the resolution of SST as-is? Discontinuities are rarely a good thing and they look wonky. Also, there is another field called TSK (skin temperature) where this effect is particularly visible - is it derived from SST and T2 or is it the input? I am asking since TSK is one of the fields that was required for running WRF when I downloaded the data in the first place.ncview.TSK_d02.jpgncview.T2_example.jpgncview.SST.jpg
 
SST in ERA5 only has valid values over the ocean. When metgrid conducts horizontal interpolation, it may result in some discontinuity.

TSK is skin temperature predicted by land model (over the ocean without sst update, it remains as skintemp at the initial time. if sst_update =1, tsk is updated by SST.)

I am suspicious that SST is somehow not continuous over the coast, which affects tsk later.

To overcome this problem, please use skintemp as SST. You cam simply delete the line for SST in Vtable.ECMWF , then rerun ungrib and metgrid.

Please let me know how this approach works.
 
I am suspicious that SST is somehow not continuous over the coast, which affects tsk later.

What do you mean by SST somehow not being continuous; did you not say that it only has valid values over the ocean, would the discontinuity not be expected then?

I'll see how the deletion of SST works (of course, first making a backup).
 
SST in ERA5 only has valid values over the ocean. When metgrid conducts horizontal interpolation, it may result in some discontinuity.

TSK is skin temperature predicted by land model (over the ocean without sst update, it remains as skintemp at the initial time. if sst_update =1, tsk is updated by SST.)

I am suspicious that SST is somehow not continuous over the coast, which affects tsk later.

To overcome this problem, please use skintemp as SST. You cam simply delete the line for SST in Vtable.ECMWF , then rerun ungrib and metgrid.

Please let me know how this approach works.

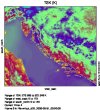
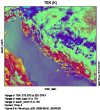
Sorry for the long delay, I was taking care of other business. I ran a pair of quick simulations with and without the modified Vtable, and here are the differences. As far as the wind speed fields, I see no appreciable difference. TSK fields are shown below without (left) and with (right) SST in the Vtable.

ncview.TSK_step4.jpgncview.TSK_step4.jpg

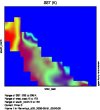
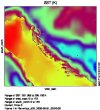
There are also the SST fields in the wrfout file, whether or not it is included in the Vtable, as you said. They are shown below without (left) and with (right) SST in the Vtable (the difference is because of different range of values in ncview; blue is 0K).

ncview.SST_step4.jpgncview.SST_step4.jpg


So, seeing this, it seems like not having SST in the Vtable should be the way to go as long as the SST updating is not important. However, if updating is important, how would one avoid these squares? Again, it seems like they don't change the land-results at all.
 
Would you please clarify whether the color scales are same for the plots you posted?
If not, can you re-plot these figures with the same color scale? I would like to make sure that skintemp and sst are same over the ocean.
 
Ah, TSK and SST for the same timestep and same range? I did not do it, so don't compare them. Two TSK plots do have the same range though (to the first decimal place), so they are comparable. I'll produce the requested images.
 
I would like to confirm that in ERA5, SKINTEMP and SST over the ocean are same. This will justify that we can use SKINTEMP to replace SST.
 
Okay, here are the pictures. I plotted all of them with the same range on the colorbar, from 281.368 to 296.105K. The first pair of pictures is SST for the simulations with (left) and without (right) SST in the Vtable. On the right picture the SST is inferred from TSK, as you've said.

ncview.SST_d03_same_span.jpgncview.SST_d03_same_span.jpg

The second pair of pictures is the TSK (values plotted for the same range) on step 0/8 (3 hour increments). Values over the sea did not change (no sst_update), but for the left picture there is a discontinuity when crossing the LANDMASK. Also, for the values over the sea, comparing the pictures it seems like TSK and SST are similar, but not quite the same. Off the coast of Ancona (X=44, Y=55), the temperature of the surface is around 0.2K higher.

ncview.TSK_d03_same_span_step0.jpgncview.TSK_d03_same_span_step0.jpg

To conclude, if SST is used, then SST and TSK over the ocean are the same, limited by the resolution of the LANDMASK (very coarse). If not, then SST inferred from TSK over the sea is not the same as it would be when SST is used.
 
Top