kalassak
New member
Hello! Some introduction: I have been trying to set up and run the MPAS-Atmosphere model (following the tutorial) and everything seemed like it was proceeding relatively well, until I ran atmosphere_model. It crashed without terminating, despite printing out a
Searching around on the forum led me to investigate whether the initial conditions had any issues, and I eventually traced the issue back to the
So here is the trouble I am coming across with the static.nc file:
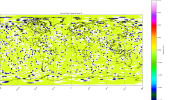
Various variables within the file are filled with erroneous, nonsensical values, to the point that I cannot plot them (without some extra work) with the MPAS-Plotting scripts.
This is because even the data defining the cell locations and bounds are incorrect.
For example, I tried to print out the values of
Nonsense values of latVertex from my static.nc:
The more reasonable values from grid.nc latVertex:
Similar issues appear with

(please excuse the awkward formatting, I quickly resized the plots for ease of viewing and made no other changes)
What is interesting is that

To try to make sense of the data and plot it visually, I had to generate the patches from the grid.nc file to produce the above plots, as the data is so mangled in static.nc and init.nc!
Other potential indicators for the issue include the fact that
Any help here is appreciated, thank you!
log.atmosphere.xxxx.err file with the following contents:
Code:
----------------------------------------------------------------------
Beginning MPAS-atmosphere Error Log File for task       2 of       4
    Opened at 2022/10/17 20:16:25
----------------------------------------------------------------------

ERROR: Error in compute_layer_mean: pressure should increase with index
Searching around on the forum led me to investigate whether the initial conditions had any issues, and I eventually traced the issue back to the
x1.10242.static.nc file, which does not seem to be generating correctly. However, when run, init_atmosphere_model does not throw any errors.So here is the trouble I am coming across with the static.nc file:
Various variables within the file are filled with erroneous, nonsensical values, to the point that I cannot plot them (without some extra work) with the MPAS-Plotting scripts.
This is because even the data defining the cell locations and bounds are incorrect.
For example, I tried to print out the values of
latVertex, and they do not match the values in the grid.nc file. Instead, they jump around randomly and regularly display extreme powers of 10, like 10^17. I would suspect they are supposed to simply be copied over from the grid.nc file and match.Nonsense values of latVertex from my static.nc:
Code:
[2.7310673115060634e+17 1.7287826538085938 -9.753121686919578e+16 ...
 -1.6915831565856934 5.242543056644729e-31 -1.6802843809127808]
The more reasonable values from grid.nc latVertex:
Code:
[ 0.45756539  0.44423887  0.45756539 ... -0.18871053 -0.91843818
 -0.91843819]
Similar issues appear with
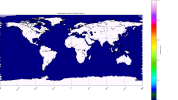
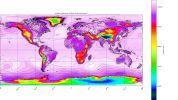
ter (terrain height) in static.nc. The max value is something like 10^38 and min around 10^-36, seemingly random:
(please excuse the awkward formatting, I quickly resized the plots for ease of viewing and made no other changes)
What is interesting is that
landmask appears to transfer just fine, perhaps because it's an integer value, and it's an issue with handling floating point numbers?
To try to make sense of the data and plot it visually, I had to generate the patches from the grid.nc file to produce the above plots, as the data is so mangled in static.nc and init.nc!
Other potential indicators for the issue include the fact that
log.init_atmosphere.0000.out displays a bunch of zeroes for the timing statistics, despite actually taking around an hour to complete. There is no log.init_atmosphere.0000.err, and the model seems to think everything went fine.Any help here is appreciated, thank you!

