Liliputian_123
Member
Hello,
This is just a general question.
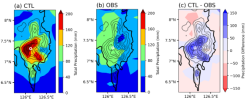
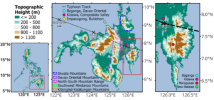
I have been simulating typhoon induced precipitation over an area that includes a mountain (bottom figure). This was run at 5x5 km with IC from ERA5.
Unfortunately, despite trying all combinations of the cumulus, microphysics, and PBL schemes, the best performing combination still show positive rainfall bias over mountains.
I have noticed a similar result even for non typhoon simulations. WRF tends to overestimate rainfall over mountains.
Do you have any suggestions on how I can further reduce this bias? I am not sure which physics scheme has more impact on orographic precipitation.
Will really appreciate any help on this.


