Hello,
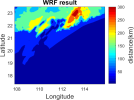
I want to use &AFWA to calculate the visibility. In the model output file, the values of the AFWA_VIS was 10 times approximately as large as the GFS 0.25° dataset and observation data in my study area, especially on land. I used different combinations of physical schemes, however the results did not improve significantly. So I want to know why the results are so big and what else can we do to improve the results.
The best physical schemes (the wind, temperature and rain were closed to the observation)in my study area as follow:
the &afwa setting in the namelist.input :
&afwa
afwa_diag_opt = 1
afwa_vis_opt = 1
afwa_cloud_opt = 1
afwa_ptype_opt = 1
/
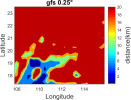
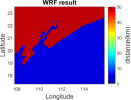
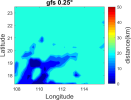
The results of visibility at the same time of wrf results and gfs0.25° as follow:
The coloabr tick number of the first two picture are same, and showing the maximum value oeach.
The third and fourth images set the same maximum value of colorbar.
 View attachment 7037
I want to use &AFWA to calculate the visibility. In the model output file, the values of the AFWA_VIS was 10 times approximately as large as the GFS 0.25° dataset and observation data in my study area, especially on land. I used different combinations of physical schemes, however the results did not improve significantly. So I want to know why the results are so big and what else can we do to improve the results.
The best physical schemes (the wind, temperature and rain were closed to the observation)in my study area as follow:
| mp_physics | WSM6 |
| cu_physics | TDK |
| ra_lw_physics | RRTM |
| ra_sw_physics | Dudhia |
| bl_pbl_physics | YSU |
| sf_sfclay_physics | Monin-Obukhov |
| sf_surface_physics | Noah |
the &afwa setting in the namelist.input :
&afwa
afwa_diag_opt = 1
afwa_vis_opt = 1
afwa_cloud_opt = 1
afwa_ptype_opt = 1
/
The results of visibility at the same time of wrf results and gfs0.25° as follow:
The coloabr tick number of the first two picture are same, and showing the maximum value oeach.
The third and fourth images set the same maximum value of colorbar.

 View attachment 7037


