Hi all,
I have a problem with the met_em* files generated by metgrid.exe similar to this post here: metgrid - SST interpolation artifacts (not solved).
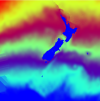
I want to run metgrid with meteorological data from ERA5 (prefix FILE:...) and climatological SST data from ERA5 (prefix SST:...). If I run metgrid without the "external" SST data (fg_name = 'FILE'), metgrid uses the SST from the meteorological input data and the interpolation works fine, resulting in smooth SST-met_em output fields. However, as soon as I try to include the "external" SST data (fg_name = 'FILE', 'SST'), I get strange interpolation artifacts in the met_em files (see screenshot).

I have produced 3-hourly metgrid files for 2004-2021 for two domains. The figure shows
the met_em.d01.2006-01-18_00:00:00.nc file. There are weird artifacts to the left and
top of D1 in all met_em files. Apart from these artifacts, the SST seems to be fine.
Both the input grib files I ran through ungrib and the SST:... intermediate files seem to be fine, so I have no idea what might be causing the interpolation artifacts in the metgrid output. I am using WPS v.4.2 with these METGRID.TBL options:
name=SST
interp_option=sixteen_pt+four_pt+wt_average_4pt+wt_average_16pt+search
masked=land
interp_mask=LANDSEA(1)
fill_missing=0.
missing_value=-1.E30
flag_in_output=FLAG_SST
I uploaded one of my yearly input grib files, a sample ungrib FILE:... and SST:... file, and one of my met_em output files here.
Do you have a hint what could be wrong?
Cheers
I have a problem with the met_em* files generated by metgrid.exe similar to this post here: metgrid - SST interpolation artifacts (not solved).
I want to run metgrid with meteorological data from ERA5 (prefix FILE:...) and climatological SST data from ERA5 (prefix SST:...). If I run metgrid without the "external" SST data (fg_name = 'FILE'), metgrid uses the SST from the meteorological input data and the interpolation works fine, resulting in smooth SST-met_em output fields. However, as soon as I try to include the "external" SST data (fg_name = 'FILE', 'SST'), I get strange interpolation artifacts in the met_em files (see screenshot).

I have produced 3-hourly metgrid files for 2004-2021 for two domains. The figure shows
the met_em.d01.2006-01-18_00:00:00.nc file. There are weird artifacts to the left and
top of D1 in all met_em files. Apart from these artifacts, the SST seems to be fine.
Both the input grib files I ran through ungrib and the SST:... intermediate files seem to be fine, so I have no idea what might be causing the interpolation artifacts in the metgrid output. I am using WPS v.4.2 with these METGRID.TBL options:
name=SST
interp_option=sixteen_pt+four_pt+wt_average_4pt+wt_average_16pt+search
masked=land
interp_mask=LANDSEA(1)
fill_missing=0.
missing_value=-1.E30
flag_in_output=FLAG_SST
I uploaded one of my yearly input grib files, a sample ungrib FILE:... and SST:... file, and one of my met_em output files here.
Do you have a hint what could be wrong?
Cheers
