Deevi Prathima
New member
Dear WRF Community,
I am running WRFV4.4.1 . In this process, I have given a test run with default namelist.wps and then ./geogrid.exe (WPS)
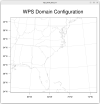
After this execution, I would like to see my domain(which is 2 domain) using ncl util/plotgrids_new.ncl. But in the plot, I could visualize only single domain instead of 2 domains.
I couldnt able to figure it out where I am going wrong, Here I am providing namelist.wps and screenshot of that ncl image..,Please go through it and do the needful .
I am running WRFV4.4.1 . In this process, I have given a test run with default namelist.wps and then ./geogrid.exe (WPS)
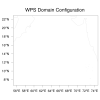
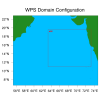
After this execution, I would like to see my domain(which is 2 domain) using ncl util/plotgrids_new.ncl. But in the plot, I could visualize only single domain instead of 2 domains.
I couldnt able to figure it out where I am going wrong, Here I am providing namelist.wps and screenshot of that ncl image..,Please go through it and do the needful .